
Q&A: What Raven’s index reveals about airlines and AI findability
AI assistants name airlines in 78% of answers but link to them in only 27%. Raven’s Louise Croft Baker explains how the Customer Growth Index was built, what it found and what airlines can do next.

Use an AI assistant to search for a flight, and it will name the airline 78% of the time, but will link to its website only 27% of the time. These figures are among the most significant Raven has collected for its Customer Growth Index, presented at the World Aviation Festival in Lisbon in October.
The index scored the digital performance of 101 airlines across four measures: AI findability, accessibility, web performance and booking flow. It offers valuable insight into the different approaches airlines use for their websites. I wrote about the index and how Finnair topped it.
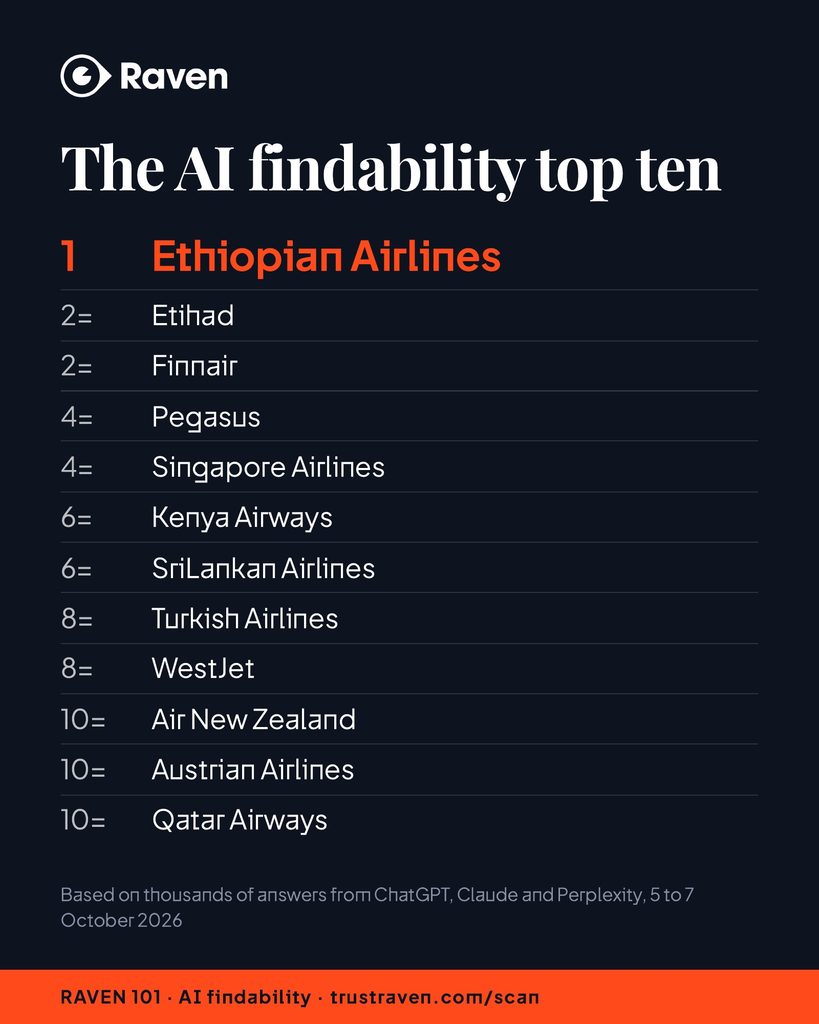
I asked Louise Croft Baker, Experience Director at Raven, a few questions to learn more about the index, how it was built, and where the company is focusing for the next editions. Louise explained that some unexpected carriers led in AI findability (Ethiopian, Kenya Airways, SriLankan, alongside Etihad and Finnair). Moreover, none of the 16,689 links to booking sites carried an affiliate tag, meaning the assistants aren’t paid to send traffic to intermediaries.
Before you read the interview, note that my original reporting said AI findability costs an estimated $3bn a year. This is not correct: Raven clarified that the figure covers all four measures, and that AI findability accounts for about 5% of it, roughly $180 million a year, though it expects that share to grow steeply as agentic AI spreads.
Answers were provided in writing and lightly edited for length and style.
The index
What gap in the market led Raven to build the Customer Growth Index, and why launch it at the IATA AGM?
Airlines measure experience in a lot of ways: NPS, Skytrax, on-time performance, conversion dashboards. None of them tell a commercial director how much potential revenue is lost before a customer reaches the booking page, or why. AI assistants have widened that blind spot. When a traveller asks ChatGPT about a route and is sent to a comparison site, the airline’s analytics show nothing, because the visit never happens.
We built the index to put a number on that, benchmarked against an airline’s peers, across AI findability, accessibility, web performance and booking flow. We launched at the IATA AGM because the people who own that revenue were in one room, and because we wanted the index seen as something for the whole industry.
How is AI findability measured in practice? Which assistants did you test, how many prompts, in which markets and languages, and how often will you repeat the measurement?
We put typical traveller questions about routes and travel needs in each airline’s markets to ChatGPT, Claude and Perplexity, and recorded two things in every answer: whether the airline was named, and whether the assistant linked to the airline’s own website. Each airline was asked 15 questions, 10 on travel needs and 5 naming the airline, plus up to three about its routes: 48 distinct questions in all, each asked twice, in English. The first edition covered 101 airlines and 9,454 answers, 6,438 of them to route and need questions, collected on 1 October 2026; the websites themselves were scanned between 5 and 7 October.
It’s worth being clear about the limits. This edition doesn’t include Google’s AI Overviews, AI Mode or Gemini due to API restrictions, and it measures whether an airline is named and linked, not whether the assistant described it correctly (though we have since begun checking accuracy on a sample). Assistants also give different answers to the same question from one day to the next, so industry-level figures like 78 and 27 per cent are robust, while an individual airline’s position should be read as directional.
We repeat the measurement monthly and plan to publish an edition each quarter; the next round runs on 1 November, and each edition will be larger.
The findings
Assistants named the right airline 78% of the time but linked to it only 27% of the time. What drives that gap?
Our data shows which sites were linked rather than why, so some of this is interpretation. The first thing to say is that the three assistants behave very differently. ChatGPT linked the airline’s own site in about half of its answers and an intermediary in one in twenty. Perplexity cites eight or ten sources in every answer and linked an intermediary 93 per cent of the time. Claude sat between the two. So much of the gap is how the assistants cite, and the figure for any one of them matters more than the average.
Beyond that, the biggest factor is search. Assistants with web search look the question up, and for most route queries comparison sites already rank above the airline in ordinary search, so the assistant inherits that ranking.
How sites are built matters too. Crawler logs analysed by Vercel found that none of the major AI crawlers render JavaScript, so route and fare information that only appears once a booking engine loads may be invisible to them. And 16 of the 101 airlines blocked our automated scanner, which suggests some may also be turning away the assistants’ own crawlers. We can’t yet confirm that for each assistant, and it’s something we’ll test directly in the next edition.
Kayak, Skyscanner and Trip.com were the domains linked most often. What are they doing that airlines are not?
They appeared in 27, 23 and 18 per cent of answers respectively. They have a page for almost every route, written to answer the question a traveller asks, with prices, durations and carriers in the page itself. They built those pages for search engines years ago, and AI assistants now benefit from the same work. Airline sites tend to be built around the booking transaction rather than the question that comes before it.
For a generic question like the cheapest flight between two cities, a comparison site is a reasonable answer. The opportunity for airlines is in questions they could own: their own routes, fares, baggage rules and assistance.
We measured links in answers, not traffic or bookings, and metasearch is a channel many airlines manage actively. The cost is paying to win back a customer who could have come direct.
How did you arrive at the estimate of around $3 billion a year in lost direct revenue?
For each airline, the index models the revenue lost to each shortfall it finds, and we added those up across the 101 airlines. The model takes each airline’s digital revenue, applies the gap we measured on each of the four pillars, and caps the total at 6 per cent of that revenue, with 1.2 per cent the most AI findability alone can account for. It’s worth being clear that the figure covers all four pillars, not AI alone: most of it sits in web performance and accessibility, and AI findability is about 5 per cent of it, roughly $180 million a year, though we expect steep growth as agentic AI continues to revolutionise the travel industry.
We present it as a range, between $2 and $4 billion a year, with around $3 billion as the central estimate. It’s a model rather than an audited figure, and we publish the method because we’d rather it was challenged than taken on trust.
Finnair came first overall at 81/100. What sets it apart, on AI findability and more broadly?
It performed strongly across the index. It was joint second on AI findability and scored 96 on accessibility, while the industry average for accessibility was 36. It scored 87 on web performance and 60 on booking flow, so there’s no area dragging it down. It also did this with around 12 million passengers a year, a fraction of the volume of several airlines it finished ahead of, which tells you this is about how a site is run rather than how big the airline or its team is.
Did you see clear differences by business model (full-service versus low-cost) or by region?
By business model, yes. Full-service carriers averaged 64 and low-cost carriers 53. Alliance membership showed up too: Star Alliance airlines averaged 64 against 56 for independents. One difference that did hold on all three assistants is that low-cost carriers get linked to their own website 8 to 16 points less often than full-service carriers, the opposite of what we expected.
Region is more interesting. The AI findability leaders included Ethiopian Airlines, Kenya Airways and SriLankan Airlines alongside Etihad and Finnair, so the strongest results weren’t concentrated in the biggest or wealthiest markets. In terms of regional averages, Europe scores highest at 68.7, followed by Africa (65.5), the Middle East (65.0) and Asia-Pacific (63.2), while North America (57.9) and Latin America (55.5) trail the field. Latin America’s average hides a wide split: Aeromexico scores 84, but most of the region’s large low-cost carriers score in the 30s and 40s, giving it the lowest median of any region at 47. The intermediary that wins is regional too: Trip.com takes the most links in Asia, Kayak everywhere else.
What airlines should do
If an airline’s commercial director asked you for the three most effective actions to take over the next six months, what would they be?
First, find out what the assistants say about you and which questions you lose. Price and route questions mostly go to comparison sites; questions about changes, refunds, families and baggage can still be won by an airline’s own pages, so that is the order in which to build content. Check that your robots file lets the assistants’ search crawlers in, for example OpenAI’s OAI-SearchBot and Anthropic’s Claude-SearchBot, while treating training access as a separate decision for legal and commercial teams. We found almost no airline blocks them, but it costs nothing to confirm.
Second, make sure route, fare and policy information is in the page itself, readable without running the booking engine, and written to answer the questions travellers actually ask. Of the 40 sites our scanner could read, 23 carried no structured data at all and only one marked up its FAQs in a form machines can read. The content comes first; the markup helps it be understood.
Third, fix the accessibility failures that stop people completing a booking. The most commonly failed requirement, on at least 59 of the 80 sites we could test, was that every control can be identified by a screen reader, and these are often inexpensive to fix. OpenAI has said its browsing agent reads a page through the same labels screen readers use, so the same fixes help agents read the site. In our own tests this month, browsing agents could read airline pages but could not yet fill in a form, so booking by agent is further off.
Alongside all three, start measuring where AI answers send your customers.
Should airlines start tracking something like an “AI link-through rate” or “share of AI answer” alongside SEO and organic traffic? Are any already doing so?
Yes, both, and I’d add a third: whether the answer about you is correct. Link-through is the one that connects to revenue today. Share of answer will matter more as agents start booking for travellers, because there may be no click to measure. Accuracy matters because an assistant quoting the wrong baggage allowance does damage whether or not it links to you.
Airlines can already see some of this. ChatGPT tags its links, utm_source=chatgpt.com from the app and utm_source=openai through its API, so those visits show up in analytics; Claude and Perplexity tag nothing, OpenAI can change its tagging at any time, and traffic from Google’s AI features can’t be separated from ordinary Google traffic in GA4. Referral data alone will undercount, which is why measuring the answers themselves matters. One thing we can rule out: none of the 16,689 links to booking sites in our data carried an affiliate tag, so the assistants are not being paid to send travellers there.
Some airlines have gone further than tracking. Iberia launched a ChatGPT app in June that lets travellers search for flights inside ChatGPT and then completes the booking on Iberia’s own platform. We haven’t yet seen any airline report these as standard metrics.
What comes next
What are the next steps for the index: a repeat edition, wider publication of the rankings, or work with alliances and industry bodies?
The next round ran on 1 November and will be published shortly, with the same method so airlines can see how they’ve moved and a larger sample of answers. We’d like to add Google’s AI features alongside ChatGPT, Claude and Perplexity and are looking for a way to do so within Google’s terms. Since World Aviation Festival, Lisbon, we have tested each assistant’s access to airline sites directly and started checking whether answers are accurate as well as linked.
We’re keen to work with alliances and industry bodies, because a common way of measuring this would help everyone. And we’re looking at how airlines’ own AI assistants perform, particularly during disruption, when travellers most need a straight answer.
About Raven
Raven is a growth and innovation consultancy for the aviation industry, helping airlines, airports and travel businesses find and recover revenue lost in their digital customer experience.
Its flagship product, the Customer Growth Index, scores organisations from 0 to 100 against their peers on AI findability, accessibility, web performance and booking flow, and puts a value on the direct revenue each shortfall puts at risk.
Raven combines automated scanning with in-house expertise in accessibility testing, traveller experience and experience strategy, so clients get practical help to act on the findings as well as a score. The team has worked across the industry, from airlines and airports to lessors, manufacturers and aviation data providers. To request a scan, visit trustraven.com/scan.
- Breaking Travel News: Raven Launches The Customer Growth Index At The IATA AGM
- Raven: Customer Growth Index
- The Top of Descent: Airlines’ AI Findability Problem: Named 78%, Linked 27%